benlong

Improve Production Lines with Industrial Automation
For the majority of production lines, speed is not an issue, but rather finding a solution to the six locations that lose time on each and every shift. For every area where automation can be implemented, automation will be beneficial. An example of this is purchasing a robot to correct an imbalance in the production line; this will only create a bottleneck that will most likely be the most costly.
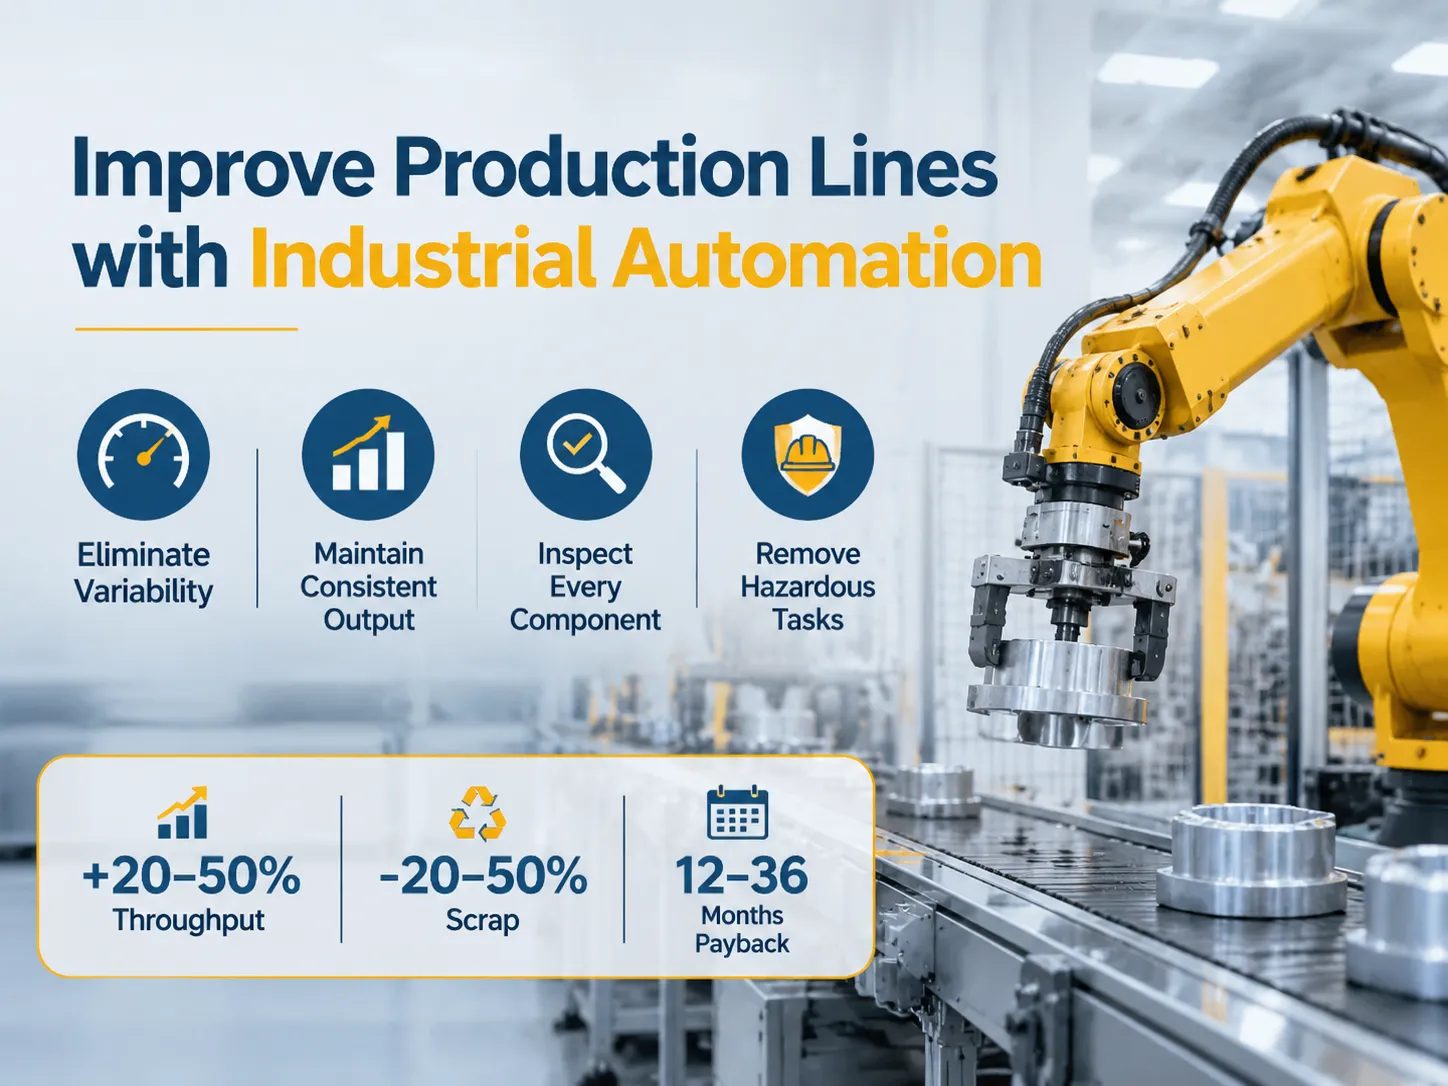
Quick answer: The benefits of implementing industrial automation into your production line are broken down into four areas; eliminating variability of manual cycle times, maintaining a consistent operating rate of the stations, inspecting every component instead of randomly sampling, and eliminating tasks that are tedious, filthy, and hazardous to the workers. Typical numbers provided by system integrators show that the throughput increases by 20 to 50 percent for existing production lines, reducing the amount of scrap for operator-judgement-based operations by 20 to 50 percent, and providing payback from 12 to 36 months. Automation, however, does not resolve issues that occur due to poorly balanced production lines, product designs that are difficult to assemble, or volatile/erratic demand patterns that make the capital investment unavailable.
The next sections describe the improvements provided through automation, the “Five D’s” (Define, Design, Develop, Deploy and Deliver), how to begin, types of automation, cycle times and balance of production lines, Overall Equipment Effectiveness (OEE) and throughput calculations, differences between sectors, comparing manual/simulation operations versus automated operations, why would you not consider automation, calculations regarding payback period, finding your range, and practical steps in implementing your first automation solution.
What Automation Actually Improves on a Line
The first benefit to your line after the introduction of automated systems is consistency. The assembly of a contactor by an individual has a variation of 10%-20% between the start of a shift and the end, whereas this is not the case with machine assembly. The machine assembly consistency is instrumental in enabling the line to be balanced at a standard cycle time, as opposed to an average cycle time. The difference between the two may be as high as 15%-25% of the total output.
The second factor is the actual percentage of units that are inspected during the process. The process of manually inspecting a sample of units as opposed to inspecting all manufactured units incurs a cost in labour; however, due to the near zero marginal cost of testing each unit in an automated production line, the likelihood of warranty returns due to defects is far greater than the impact on production throughput.
A third factor is the elimination of the tasks that people do poorly. An example of this type of task would be loading a small part into a fixture that requires the use of a torque wrench at an awkward angle, or checking the label on a product in a dimly lit area. These types of activities are where people will tend to produce the majority of their defects, and they also tend to have the highest turnover rates among all workers in manual assembly lines.
Fourthly, there is the data. Shift-based production reporting from manual assembly lines, and unit production reporting from automated production lines, provide a historical record of each station on a quality problem, which is mandatory for customer audits.
The Five D’s, Where to Begin
While the five D’s are merely a screening mechanism and not a formalised method of determining a process improvement, it is based on priority of task assignment by how much a person dislikes the assigned task. Dull work involves repetitive tasks that require little or no decision-making ability, while dirty work is the assembly of product while being exposed to oils, dust, swarf or chemicals. Work done close to machinery that is constantly changing, works with great heat, works with dangerous sharp edges, or works at great heights is classified as Dangerous work. Work that can be physically exhausting for eight hours because it requires a physical position that is unnatural for a person to maintain for eight hours is classified as Difficult work. Work that cannot be performed on a continuous basis because it requires a large number of skilled people or extreme production lead times is classified as Dear work.
A utility score of one or more indicates that a task should be automated. A utility score of zero generally means that the task would be better left to a human being, as Automating the task would eliminate the flexibility a human being has to provide.
The utility score also indicates the greatest potential for return on investment (ROI) with automation. The costs associated with work that is classified as Dirty or Dangerous work do not appear on an hourly basis within the wage rates associated with Dirty and Dangerous work, and projects that are solely justified on the basis of safety often achieve ROI sooner than predicted by an analysis based on wage rate.
The Four Types of Industrial Automation
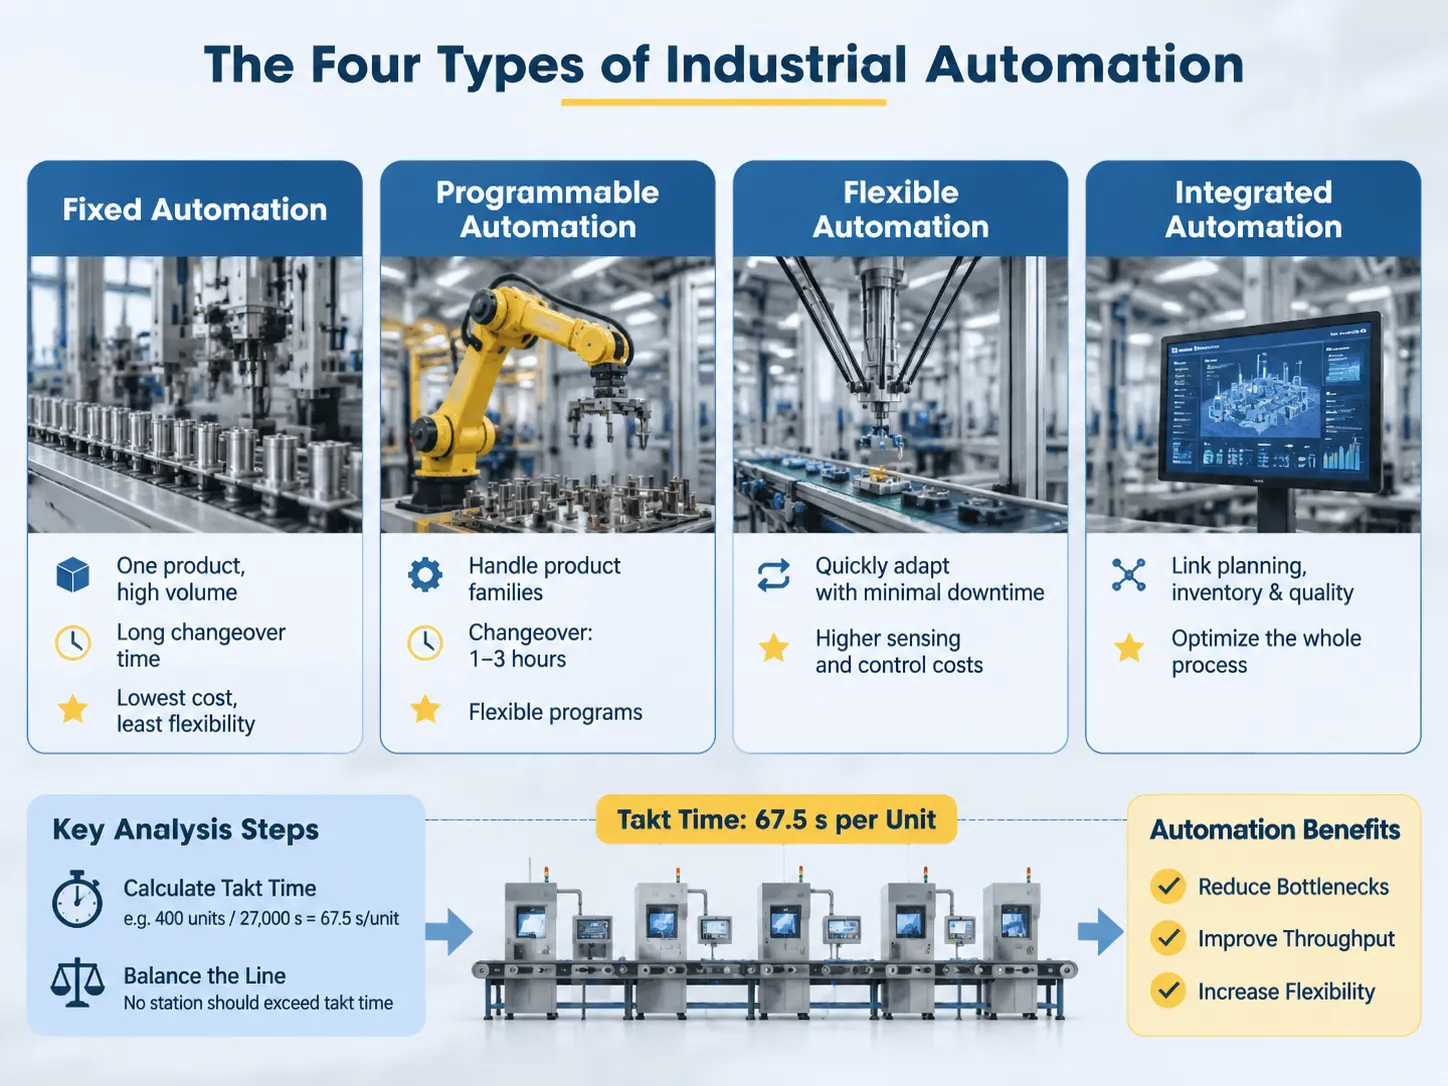
Fixed automation is designed to manufacture one product in large quantities, and consists of dedicated stations for the automated transfer of products from one manufacturing station to another. The length of time needed to perform a product changeover using fixed automation is typically greater than the amount of time required to manufacture a product, and fixed automation will usually have both the lowest unit manufacturing costs and the least amount of flexibility for production. Fixed automation will usually be the best choice for manufacturing a product with a 5-year product life cycle and a stable product design.
Programmable automation systems are designed to handle groups of products and are able to change programs and tooling without completely removing products from the production line or a manufacturing station. Examples of programmable automation include robotic cells with interchangeable end effectors (grippers), CNC systems, and automated tester stations that run different test programs based on the products they are testing. The length of time required to change from one program/tooling combination to another will typically be between 1 and 3 hours, depending on the number of parts required to manufacture a run of products.
Flexible automation systems are capable of being modified, with little or no downtime between the completion of one production run and the beginning of the next production run, and therefore have more flexibility than programmable automation systems. Higher sensing and control costs are noted, and they only make sense when there are frequent variations in the product mix; this is becoming more common in consumer goods.
Integrated automation represents the fourth type of automation; it is correctly described as a manufacturing system rather than just a machine. The production line is linked to the planning, inventory, and quality systems. Changes to the production schedule, are propagated through to the various stations that comprise the production line. The MES layer is where the digital twin and MES interact to allow a plant to stop optimising each station and begin to optimise the flow of the entire manufacturing process.
The majority of factories will initially require the second type of automation. Automating the elimination of the worst operation on the production line will generate more value than implementing a fully automated manufacturing system which is still experiencing delay from using manual bottlenecks.A production line will produce at the speed of its slowest component. Therefore, if automation is introduced to accelerate a line’s slowest component (not the bottleneck), the result will be more inventory, but not increased production. This should be the first step in the analysis, which requires a stopwatch and spreadsheet, as opposed to a capital expense.
Determining how to synchronise the production is a simple mathematical exercise. If 400 units are required per shift, for 27000 seconds, then the takt time is 67.5 seconds per unit. No production station should exceed this takt time. If there is a station taking 90 seconds to produce one unit, then the maximum throughput for that production line will be 300 units produced per shift, regardless of how fast the other production stations operate. Conversely, if there is a station producing at a takt time of 30 seconds, that station should be evaluated for combining with the next closest production station’s takt time (or operation). When transportation times differ widely between stations on a production line, it can impact the average output of the line and cause it to be less than the takt time (the average time that should be taken to produce one unit of product). When a number of stations have significantly different production times (i.e., one station is much faster than another) but all are producing at an average rate below takt, the average production from the production line is reduced. The advantage in that instance, then, is to reduce the spread of those times rather than the average time for all stations, assuming the production capability of each station is equal.
Automation addresses this issue in two ways: First, automation allows for the possibility that the production line will run at a speed lower than takt when the production person is not able to maintain the production line’s speed at a consistent level; second, automation allows for a production line to be kept at the takt speed, even as production standards vary. Both of these benefits of automation provide a benefit to production lines that are already balanced.
In fact, the benefits of automation for buyers of production line automation solutions differ, depending on whether a production line is currently balanced or needs to be configured as a balanced line (i.e., production speed and production quality must be taken into consideration in selecting the right type of automation). This differentiation is clear when comparing automated production lines.
From the View of the Numbers: OEE and Throughput
Overall Equipment Effectiveness (OEE) is defined as the product of availability, performance, and quality. OEE is known as “Overall Equipment Effectiveness” and, thus, represents the overall effectiveness of equipment available for production (the number that accounts for most of the disparity between the actual and rated production speeds). World-class OEE is generally cited as being 85%; however, the average production for a given manufacturing facility typically operates between 60% and 70%. The primary reason for the difference in overall equipment effectiveness is usually based on availability; that is, when equipment fails to function or breaks down.
Availability-related losses consist of losses from downtime due to breakdowns, waiting, and changeovers. Performance-related losses consist of losses from reduced speeds and small stoppages. Quality-related losses consist of losses from scrap and rework. Automation addresses each of the three categories of equipment effectiveness (i.e., availability, performance, and quality): Quick-change tooling increases availability during changeovers; Condition Monitoring reduces equipment availability during breakdowns; and in-line inspections reduce scrap that would be discovered later in the production process (i.e., downstream). Integrators are reporting throughput improvements in existing applications of between 20% and 50% primarily due to increases in both availability and performance, as opposed to simply increasing the speed of the operating machine. For example, an increase of ten points in OEE (Overall Equipment Effectiveness) is estimated to provide an increase of approximately 15% in the amount of product produced without the need to add new equipment. This is the primary reason for the first project on a line to be data collection rather than the installation of robotic technology.
Constraints Differ by Sector
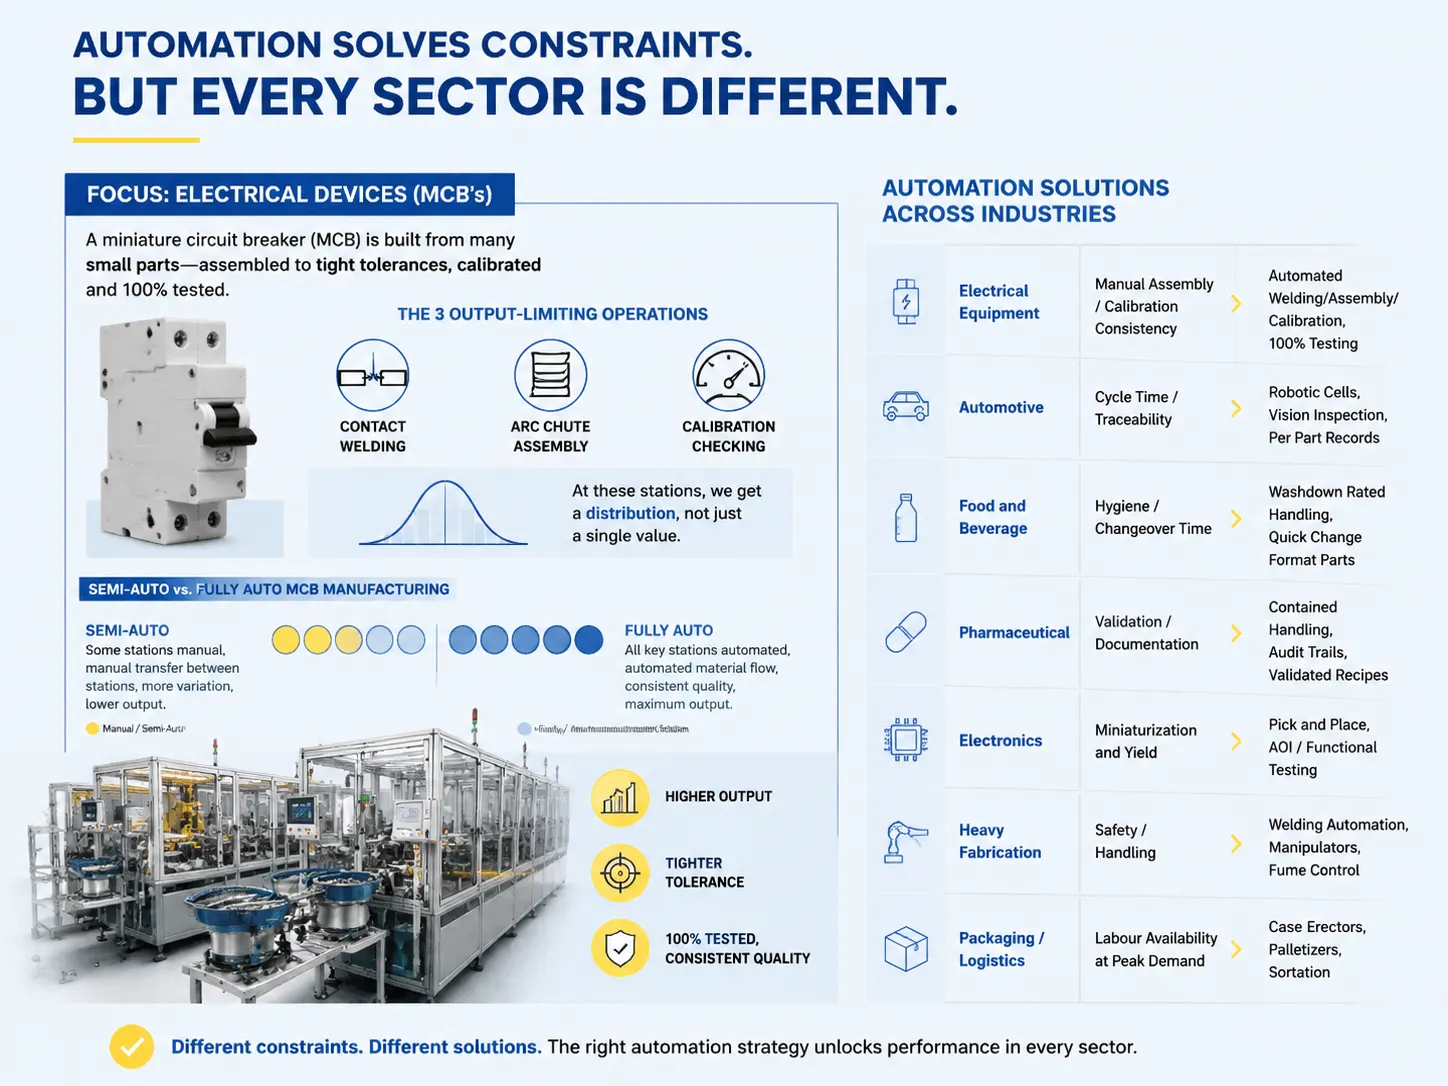
Constraints differ by sector; in addition, the methodology for automation that resolves these constraints is also different for each sector.
| Industry | Type of Constraint | Improvement Through Automation |
|---|---|---|
| Electrical Equipment (MCCB’s, MCB’s, Contactors) | Manual Assembly of Small Parts/Calibration Consistency | Automated Welding/Assembly/Calibration, 100% Testing |
| Automotive | Cycle Time/Traceability | Robotic Cells, Vision Inspection, Per Part Records |
| Food and Beverage | Hygiene/Changeover Time | Washdown Rated Handling, Quick Change Format Parts |
| Pharmaceutical | Validation/Documentation | Contained Handling, Audit Trails, Validated Recipes |
| Electronics | Miniaturization and Yield | Pick and Place, AOI/Functional Testing |
| Heavy Fabrication | Safety/Handling | Welding Automation, Manipulators, Fume Control |
| Packaging/Logistics | Labour Availability at Peak Demand | Case Erectors, Palletizers, Sortation |
There should be further elaboration about the electrical devices category, as this is the area of focus for our organization. A miniature circuit breaker consists of many small parts which are assembled to a certain tolerance, calibrated and tested. Three operations limit output from MCB’s: contact welding, arc chute assembly and calibration checking. All of these stations are where you generate a distribution rather than only a value, and also the automated cells represent a number of values that have a distribution around them. The primary distinction between semi-auto and fully auto MCB manufacturing is simply how many of those stations are fully automated and how the equipment is supplied to and from those stations.
Manual, Semi-Automatic or Automatic
Each of the models listed in the table represents an option for the buyer to evaluate. Here’s how they compare:
| Model | Output vs manual | Consistency | Capital cost | Best for |
|---|---|---|---|---|
| Manual line | Baseline (1x) | Fluctuates 10-20% across the shift | Inexpensive to purchase and maintain | Low volume, high mix and fluctuating demand |
| Semi-automatic | 1.5 – 2.5x | Stable and predictable at the automated stations | Moderate | A limited number of hard-set products on an otherwise manual line |
| Fully automatic | 3 – 6x | Extremely consistent, with a measured distribution | Highest | Stable, high volume at the closest possible tolerance |
| Flexible cell | 2 – 4x | Consistent, dependent on the number and type of variants | Moderate to high | A group of similar products with frequent tooling changes |
The semi-automatic row should be the model that plants consider first. The semi-automatic row captures the critical point of operation, but does not require the company to invest in an entire line. The semi-automatic model can be installed during the plant’s next shutdown, and once installed will provide the operating information to help determine the future line investment.
There is a hidden cost that the buyer will likely not consider with the fully automated row: Feeding the fully automated line. Engineering is not just all the parts that make up the stations. The connectors, buffers, and ways to move the materials are all part of the engineering of the station. If a bowl feeder jams and stops the line, you have not saved the line anything at all.
When Automation Doesn’t Help
Four instances where it makes more sense to spend the same amount of money somewhere else. Demand is erratic, the line will be sitting idle for six months every year. The design cycles for the product are every 18 months, so the tooling will be obsolete by the time any return is realized. The bottleneck is not in the line itself, but is in the upstream portion of material supply or handling, and the line is perfectly suited for the type of product you are creating. And the cost of labor on a per unit basis is low enough that the expected return on investment will exceed the life of the asset, which is common for low-cost labor markets producing low-volume goods.
The fifth situation occurs more frequently than the previous four combined; the process is not currently capable. If you have a manual work station that produces 5% defect parts due to a poorly designed fixture, your automation will repeat that process and generate defective parts. The process must be capable of producing acceptable parts before you can think of automating it; that is an engineering/design issue, not an investment/capital issue.
Payback and How to Calculate
The calculations for determining the payback period are easier than you may think when you are reading through the spreadsheet. To calculate the annual savings, you take the total number of labour hours saved (which is included in the loaded rate) and then multiply that by the loaded rate; then you take the scrap savings times the unit cost; and finally you take the throughput improvements times the contribution margin. The total investment consists of the cost of the equipment, installation, downtime during commissioning, and training expenses.
There are two areas not included in your calculations, but both items are important. The costs we incur every year to maintain our new equipment will be a real number, not an estimate. A line that can manufacture products at a higher rate, but identifies and addresses faults later, adds to our additional work expenses.
The time frame for the return on investment for most projects is between 12 months and 36 months. If a project takes longer than 36 months to recoup its costs, it should have a strategic reason for doing so, rather than a financial reason. The disadvantage of the longer investment time is offset by the reduced start-up time of a production line designed using a digital twin, meaning that the overall gain in payback should incentivize a project to be completed faster than projects utilizing standard methods of production.
How Benlong Relates to This
We design and manufacture automated and semi-automated production lines to produce electrical devices such as assembly, weld, calibrate, test, and transport materials through the facility. We use a modular approach to the assembly lines, which allows us to add or rearrange stations throughout our line as products are developed, rather than relying on a fixed line layout that will become obsolete as products are developed.
We offer our customers knowledge of their process rather than just a catalogue of machines they may purchase. For example, a contactor line and circuit breaker line both face challenges related to welding and calibration. Our extensive experience in the manufacturing of both products, as well as the machines that produce them, gives us a unique perspective on how to resolve these issues. This differentiates us from many robot integrators who generally rely on other resources to gain business.
We do not develop or manufacture any equipment or materials associated with a facility’s outside-of-the-line material movement or implement a manufacturing execution system. The elements of a project, including the systems integrator and consequently the supplier, are the responsibility of the plant.
A Practical Sequence for a First Project
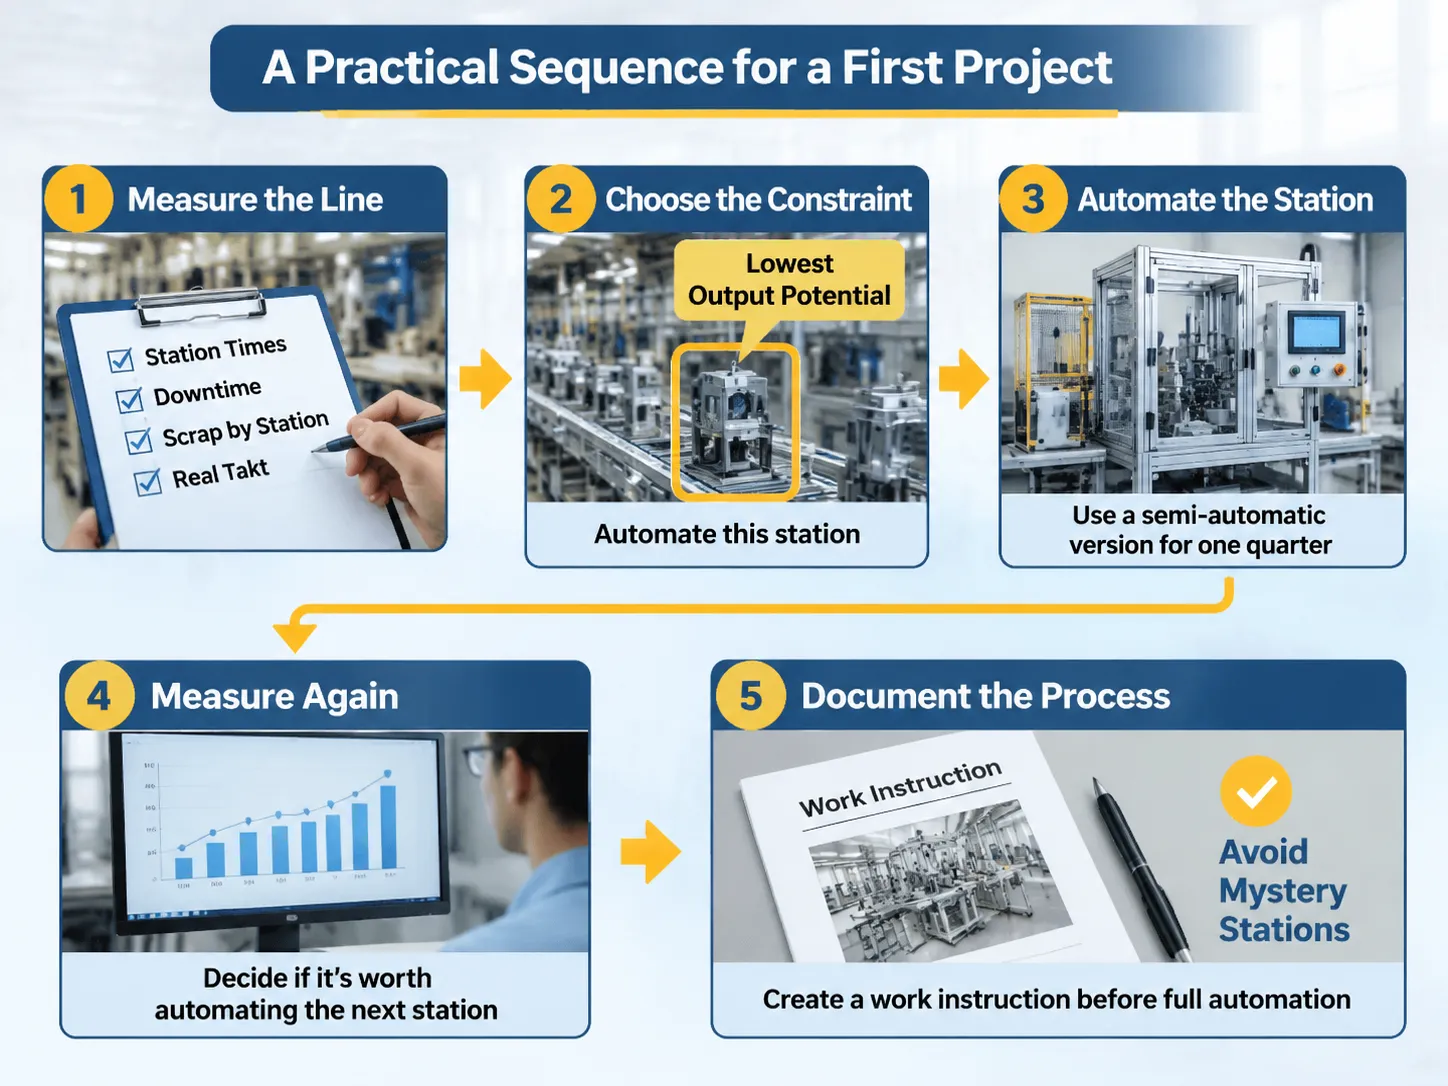
The first project will have to follow these five steps:
- Measure the line: measured output should include measured station times, downtime, scrap by station, and real takt.
- Choose the constraint: choose the station with the lowest output potential instead of the one with the highest actual output; this station must be automated.
- The best way to automate this station is to buy a semi-automatic version of it and then use it for one quarter of production.
- Measure again and decide if it is worth automating the next station using the new data.
- Most projects fail to complete step five; this is to document the entire process before automation. If a station is automated without providing a work instruction to the operator, that station is like a mystery to its operator and nobody will be able to improve it. The automated inspection machine is a good example because it is only worth the investment if the inspector can properly identify the defect to be inspected.
Questions and Answers
What are the five D’s of automation?
Dull, Dirty, Dangerous, Difficult, and Dear; these five D’s are useful in identifying which tasks are potentially automatable based on how much a person hates doing that task and on how much it costs on a “per-unit” basis to do that task. If a task qualifies for two or more of the five D’s, it is most likely a good candidate for automation.
What are some ideas to improve production efficiency?
To improvethe efficiency of a production line, it is important to balance it to the takt time. This includes removing any bottlenecks or restraints that slow down the production line, investing in tooling that allows for quick changeovers between products, inspecting products as they are manufactured instead of inspecting them once they are finished and measuring OEE (overall equipment efficiency) to identify losses in your production system. There are four basic types of automation: fixed automation for a specific product produced in high volume, programmable automation for a series of similar products produced at a lower volume and flexible automation, meaning that the automation system can handle multiple varieties of the same product without stopping to be reconfigured. Integrated automation is when the automation system can communicate with the planning and quality systems that support it.
Automation will improve your manufacturing efficiency by eliminating variations in cycle times, holding the production stations to the takt time, testing every product being produced rather than sampling, and removing tasks from the production process that humans do poorly. Reported improvements in manufacturing productivity due to automation systems are typically in the range of 20%-50% greater output based on the same floor space and 20%-50% less scrap where human error has been identified as the cause of the defect.
When should a factory automate?
There are some general guidelines and rules about when to implement automation in your facility. Generally, if a production line is balanced (to the takt time), has a capable (zero defects) process, and has a stable enough demand to justify the capital investment, then it is a good idea to implement automation. Implementing automation on an unbalanced or an incapable process simply reproduces the same problem but with greater capital investment.
Does automation reduce headcount?
Another common myth about automation is that it will reduce labor costs. Automation will generate improved manufacturing productivity through savings in hours per unit; savings in labor hours are not the same thing as savings in the number of employees in a manufacturing facility. Most manufacturing plants that implement automation on a production station will simply reassign the operator to another production station that is more difficult to automate. This is because the manufacturing productivity improvements appear as improvement in output per employee rather than a reduction in workforce size.
References
- Rockwell Automation – Production Line Integration and OEE
- Siemens – Digital Twin and Manufacturing Automation
- Keyence – In-Line Inspection and Vision Systems
- Bosch Rexroth – Assembly Line Transport and Handling
- A3 – Automation Industry Data and Case Studies
Conclusion
Automation improves production efficiency by improving the consistency of manufacturing processes, improving the coverage of the production line by eliminating bad stations and producing data to measure performance. Automation will not improve an unbalanced, incapable or low demand production line. Unfortunately, these types of production lines are all too often more common than those with a technological gap.
The sequence for successfully implementing automation is measuring, constraining and automating one station at a time, and then measuring again. The sequence for failing with automation is to purchase a robotic system and then look for something to use it on.