benlong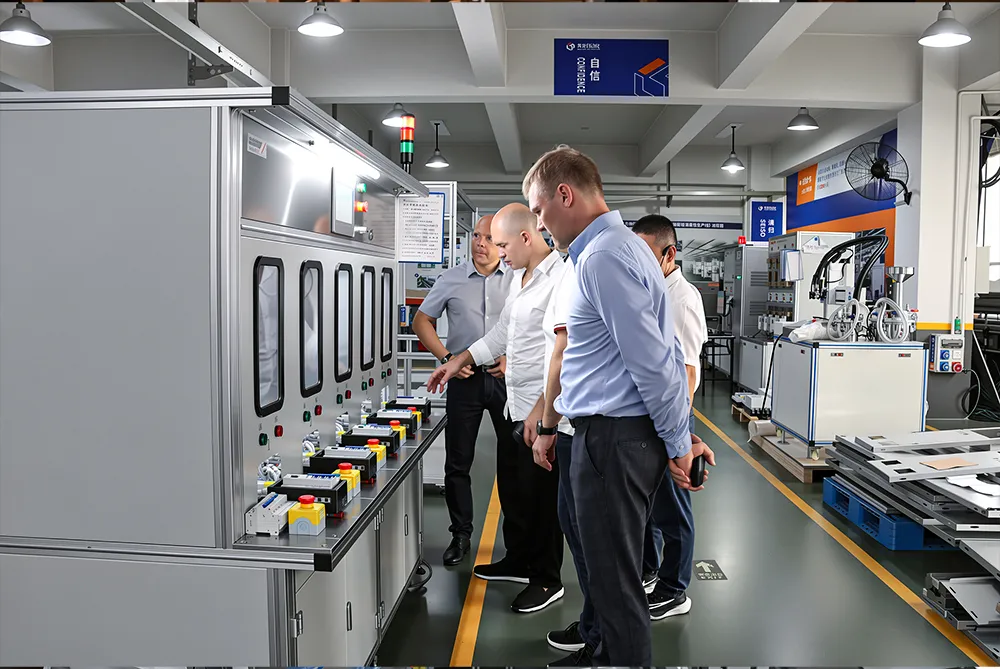


Automated vs Manual MCB Testing: When Does the Investment Pay Off?
A miniature circuit breaker OEM factory in Haryana, India, was running 8 to 10 hour shifts and still topping out at 2,000 poles per day. Its biggest customer, Siemens India, needed monthly volumes the manual line simply could not deliver, no matter how much overtime was scheduled. Faced with the choice between losing the contract and changing how the product was made, the manufacturer invested in an MCB automatic testing line. Today the same factory produces a stable 15,000 poles per day, holds first pass yield above 90%, and has since won additional OEM orders from other large brands. Most of the original workforce was not dismissed; they moved to component preparation and final packaging, the stages where human flexibility still beats machinery.
The phrase “7.5 times more output per day” is a catchy title, although still not the one that the factory owner actually cares about. The numbers that the factory owner is interested in are useful for making a decision about whether to buy this type of equipment. Essentially, what are the costs of manual testing per month, what are the savings for an automated line and when will a factory owner get back the investment. This guide shows the hidden cost structure of the manual processes, makes comparison with automated ones, provides a payback formula to be used for any factory and tells the volumes at which the crossover took place.
The Real Cost of Manual Testing and Assembly Is Not the Wage Bill
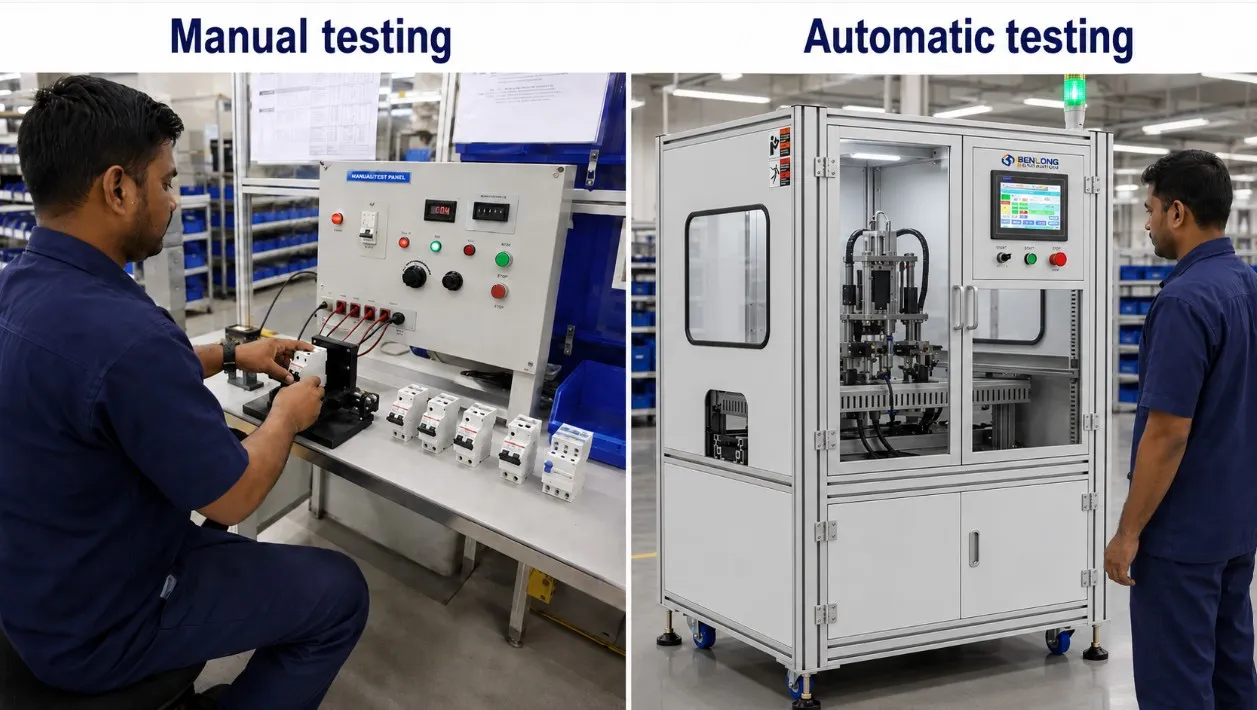
When manufacturers examine manual versus automated production, the first thought is to look at the cost of an operator’s wages in relation to the cost of a machine. However, such a comparison is misleading because direct wages generally account for less than 50% of the total cost of manual assembly.
The scrap and rework constitute the greatest hidden cost. The defect rate for manually assembled and manually adjusted lines usually falls between 1% and 5%. Before being detected, a defective part consumes the same amount of the resources such as materials, machine hours, and floor space as a functional one. Warranty claims and returns will be incurred for units which were not detected defective. When it comes to safety-critical equipment like MCBs, rejection of a single batch by a certifying authority or a major client can wipe out the savings from a year of work in terms of wages.
Next, there is variability. he manual output is affected by various factors such as the shifts, festive seasons or high turnover months when output decreases and also the skill level of the operator at work. The Haryana factory mentioned here had a lot of work going on but did not have anything consistent about it. Overtime allowed production of more goods but brought fatigue-related defects which many manufacturers are familiar with. Finally, among the unseen costs of production is training period which takes place in a tight labor market.
Manual vs Automated: The Cost Structure Side by Side
| Cost Driver | Manual Assembly and Testing | Automated Line (Amortised Over 8-10 Years) |
|---|---|---|
| Direct labour per unit | $0.40-$1.50 depending on region | $0.05-$0.20 (a small monitoring team) |
| Defect and rework rate | 1-5% of output, operator-dependent | 0.1-0.5%, process-controlled |
| Daily throughput (MCB example) | About 2,000 poles per 8-10 hour shift | 15,000 poles or more, extendable to 24/7 |
| Output consistency | Varies by shift, season, and turnover | Fixed cycle time, no fatigue effect |
| Test data and traceability | Paper records or none | Every unit logged against a serial number |
| Training and turnover cost | Continuous and rising | Concentrated in a small skilled team |
The traceability row deserves attention, because it is the one that wins contracts rather than merely cutting costs. Large OEM buyers increasingly require calibration and test data for every individual unit. A factory that can hand over a serial-number-linked test record for each pole is bidding in a different league from one that cannot, regardless of price.
What Determines the Size of the Investment
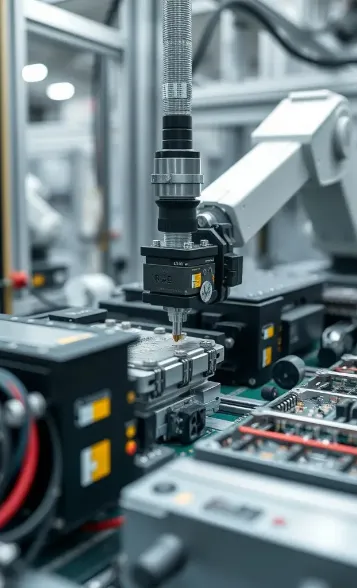
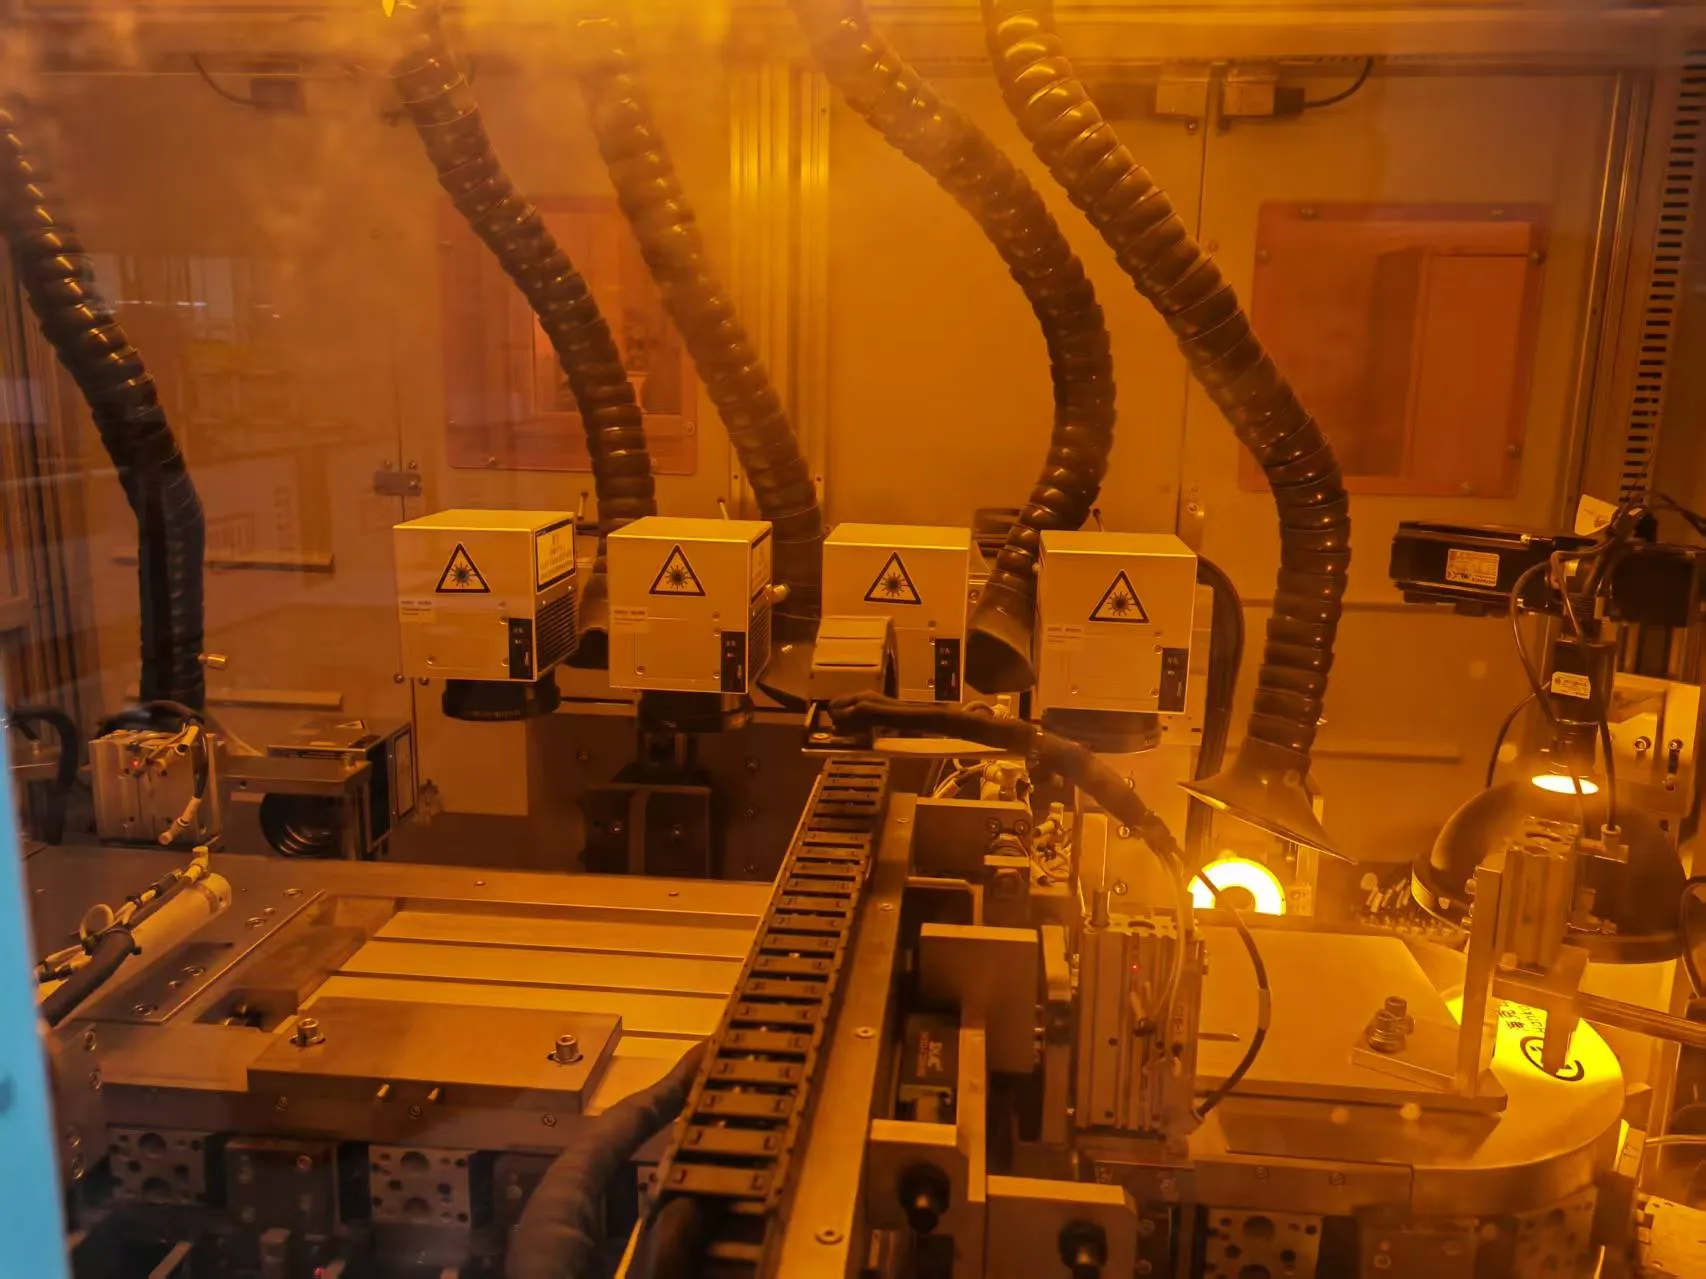
An automated line functions as equipment already configured to specification rather than as a product under its own name that can be found in the catalog. In practice, the investment depends on the specifications determined by the number of stations, the target cycle time, the types of products to be manufactured, as well as the level of testing and data integration. To illustrate, the construction of one line for moderate-speed creation of a single type of MCB frame is much more straightforward than making a line for switching between several types of frame sizes and processing complete test data for each pole.
There are two commonly omitted elements in budgeting that are much more significant than any full value of the project. The first is commissioning and operator training, which makes the necessity of choosing an experienced builder who specializes in installation and ramp-up support more meaningful than the cheapest quotation. The second is stability of the product design: automation of the product that is going to be redesigned is a waste of tooling, thus the best time for putting the money into the project is when the design is completed and volumes are increasing.
The Payback Formula You Can Apply to Your Own Factory
The payback period of an automated line is not mysterious. It reduces to one fraction:
The return period (months) = The total investment / (Monthly labour savings + Monthly cost reductions from scrap and rework + Monthly profitability from increased sales).
Work through it with realistic inputs. Imagine that a manual testing section involves 20 employees, and the automation results in a monitoring team consisting of just 4 employees; the savings of salary payments will be immediate and constant. Assume that a 3% loss from defects becomes less than 0.5%; what does it add up to on meaningful production volume in the course of one month? However, the third figure is usually the biggest which is commonly underestimated by the majority of plants: namely, the contribution margin from the volume produced for the first time.
The manufacturer from Haryana provides the best example of the third point made earlier. The line generated added capacity through an existing long-term, stable partnership with Siemens India, every pole produced by the line has already been sold. Therefore, the project was able to reach complete payback within a period of 12–24 months from commissioning. The model of this operation is what should be used by the others: the returns from automation are seen fastest when it is matched to the demand for the output.
When Does Automation Become Worth It? The Crossover Point
Automation may not be applicable in all factories. In the case of simple products with minimal components and low defect probabilities, manual production methods can remain the economical option for very high production levels, even exceeding 100,000 units of yearly output. In contrast to its counterparts, the transition point for complex, safety-critical products that are tested individually occurs much earlier – usually at relatively low production levels of less than 50,000 units annually- due to the scaling effect of testing expenses, certification requirements, and defect risks.
The existence of three signs indicates that a producer has achieved the crossover point. To start with, demand has been lost because the production line cannot keep up; meaning that the margin on this lost demand is now larger than the cost of capacity. Secondly, a significant client or certification institution has made new quality or traceability requests that cannot be documented via labor-intensive processes. To conclude, labor cost/availability is producing a situation where all next years of labor-intensive production will be costing more than the previous ones. The manufacturer from Haryana has experienced all three signals at once, while most companies face only one signal at a time; wise ones act right upon the first signal instead of waiting for the third one.
You Do Not Have to Automate Everything at Once
For the majority of small- and medium-sized manufacturers, the most cost-effective solution is staged automation, which usually begins with testing rather than manufacturing. Testing is the process where certification requirements become crucial, where data traceability is required, and where one automated line operates instead of many troublesome manual processes. Manufacturing processes may follow after the required amounts have been achieved, and it is common for the factory to automate calibration and testing first, analyze the results, and then move on to the assembly stage in the second phase of automation.
Benlong Automation designs its equipment around exactly this progression: standalone testing benches, full automatic testing lines, and integrated lines such as the MCB automatic assembly line and MCCB automatic production line that can be expanded station by station. For a station-by-station technical walkthrough, see our complete guide: What Is an MCB Automatic Testing Line? A Complete Technical Guide.
Frequently Asked Questions
What determines the cost of an automatic assembly line?
The number of stations, the acceptable cycle time, the variety of products the line must produce, and the depth of testing and data integration are critical factors driving the investment. Additionally, configuration and training, along with after sales support needs to be factored in the budget. Since the commissioning of each line requires attention to a specific product and production capacity, it is always a technical study that gives a meaningful value for that.
What is a good payback period for factory automation?
In the circuit breaker and low-voltage electrical industry, the payback period for assembly and testing lines is usually between 12 to 24 months when the additional capacity is justified by actual demand like a long-term OEM contract. Payback periods that are lower than 3 years are generally regarded as good investments in equipment that has a lifespan of 8 to 15 years.
Is automation cheaper than manual labor?
Yes, above a certain production volume, and usually by a wider margin than the ratio of wages indicates. This is because automation cuts down on defects, rework, warranty liability, and training expenses, in addition to producing unit-level testing data unattainable through manual operations. With lower production volume, however, manual and semi-automated production options are still more cost-effective.
How many workers does an automated production line replace?
In the usual automation department, there will be a significant drop in human beings operating machines because of the automation process, but most of them will be re-deployed to other tasks. In this instance, the particular factory concerned re-allocated the displaced people to more interesting jobs, and the factory managed to multiply its output by 7.5, which means that the factory has achieved much higher output per worker than the number of workers decreased.
Conclusion
The question seldom pertains to whether the cost of automated testing will outweigh its gains. Instead, the concerns are more about determining the limits of volume and quality that would be necessary for that change to occur. For your own calculations where MCBs, MCCBs or similar low-voltage products are involved, please contact Benlong Automation.